I’ve been running the same Prometheus monitoring stack on my homeservers for years. It worked fine — but it was more complex than it needed to be. node_exporter and cAdvisor are two separate containers doing one job: telling me what the machine and its containers are up to. And cAdvisor, it turns out, was the heaviest thing in my entire monitoring stack. I wanted something simpler and leaner.
This is Part 1 — the motivation and the migration steps. Part 2 covers the actual before/after numbers.
The Old Stack
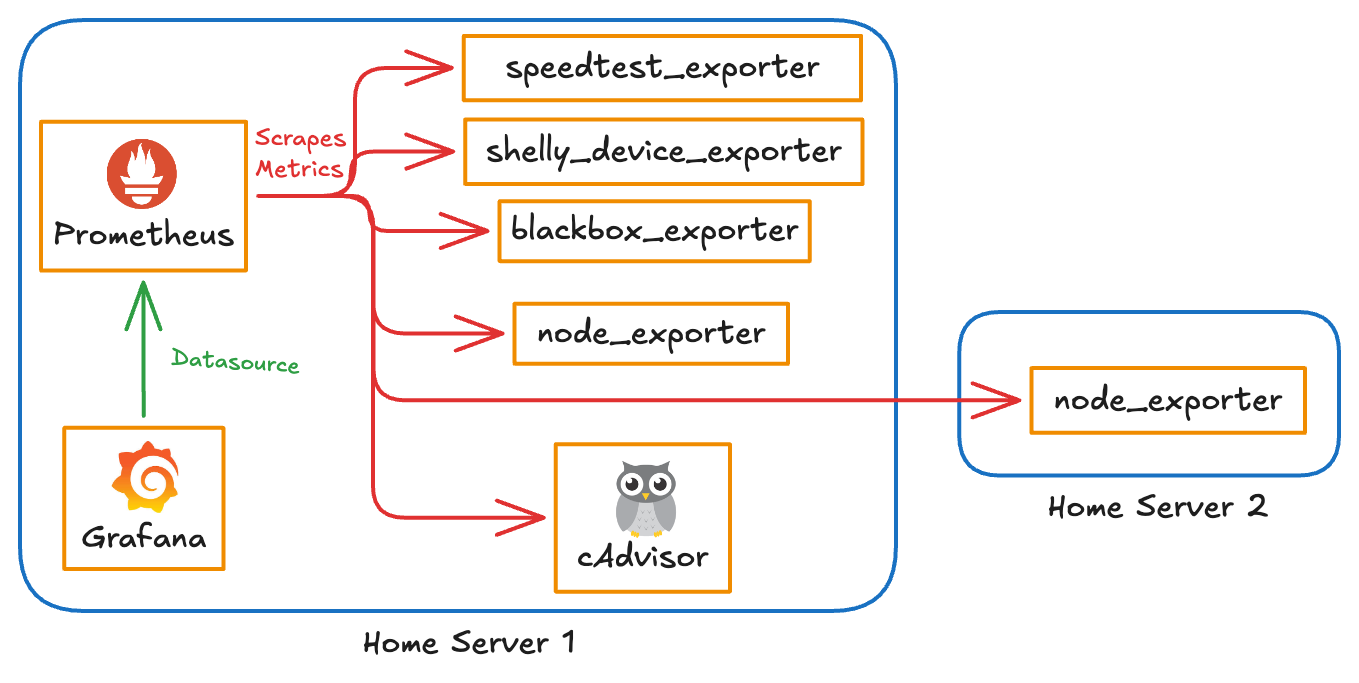
For context, here’s everything I was running for monitoring:
| Tool | Description |
|---|---|
| Prometheus | TSDB to store metrics |
| node_exporter | Machine-level metrics (CPU, memory, disk, network) |
| cAdvisor | Per-container resource metrics |
| blackbox_exporter | HTTP/TCP endpoint probing |
| speedtest_exporter | Internet speed metrics |
| shelly_device_exporter | Power consumption and cost tracking |
That’s six separate exporters plus Prometheus itself. Standard setup for anyone serious about homeserver observability — but it adds up.
Why I Wanted to Change
Two things were bothering me about the old stack.
First, simplicity. Running node_exporter and cAdvisor as separate containers just to monitor the machine and its containers felt like unnecessary overhead. I wanted a single agent that could do both jobs — less to maintain, less to update, fewer moving parts.
Second, resource usage. My two home servers are a Raspberry Pi and an old Lenovo laptop. Neither has headroom to waste. After I set up power tracking with a Shelly plug, I noticed CPU spikes correlated with power consumption — obvious in hindsight, but it made me look harder at what was burning cycles for no good reason.
The monitoring stack itself was on the list.
node_exporter
No complaints here. Lightweight by design.
cAdvisor
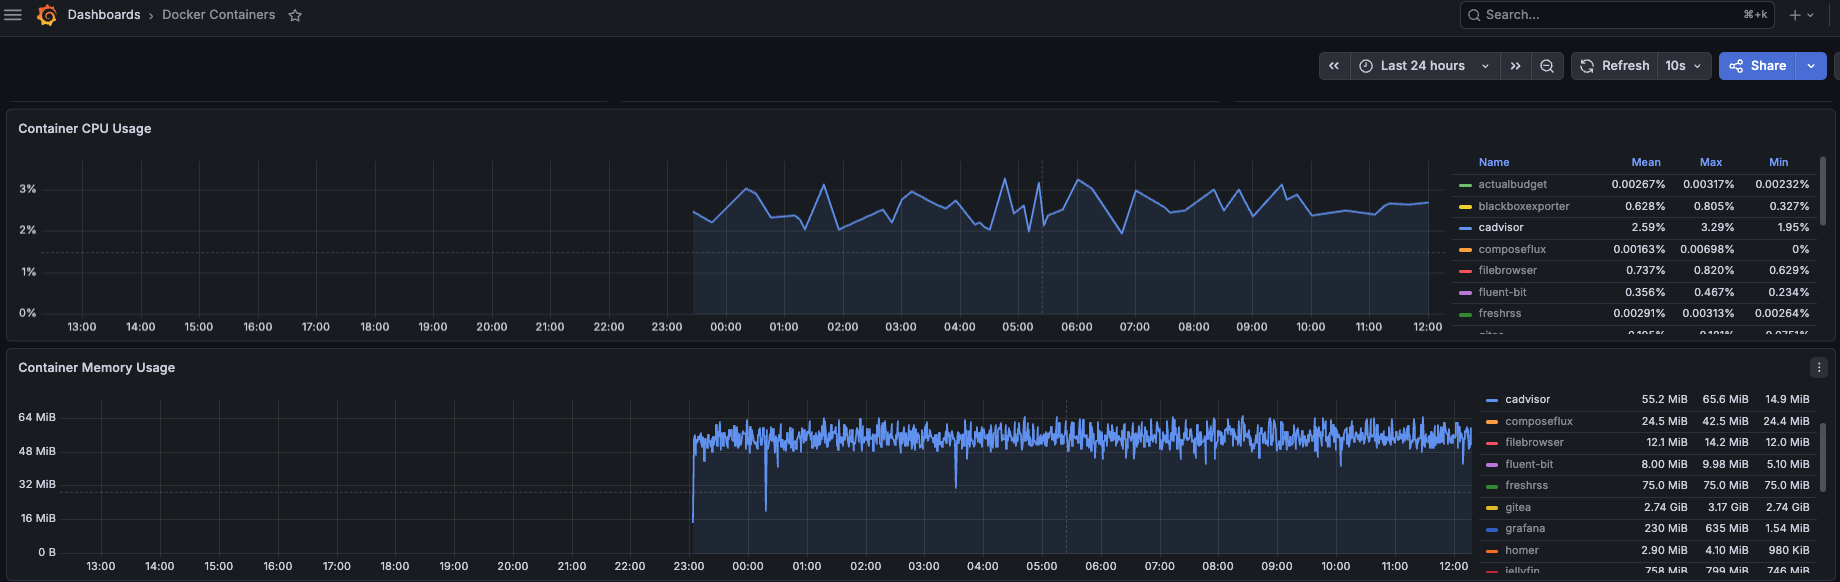
This was the problem. cAdvisor has improved in recent versions, but it’s still noticeably heavier than everything else in the monitoring stack.
Prometheus
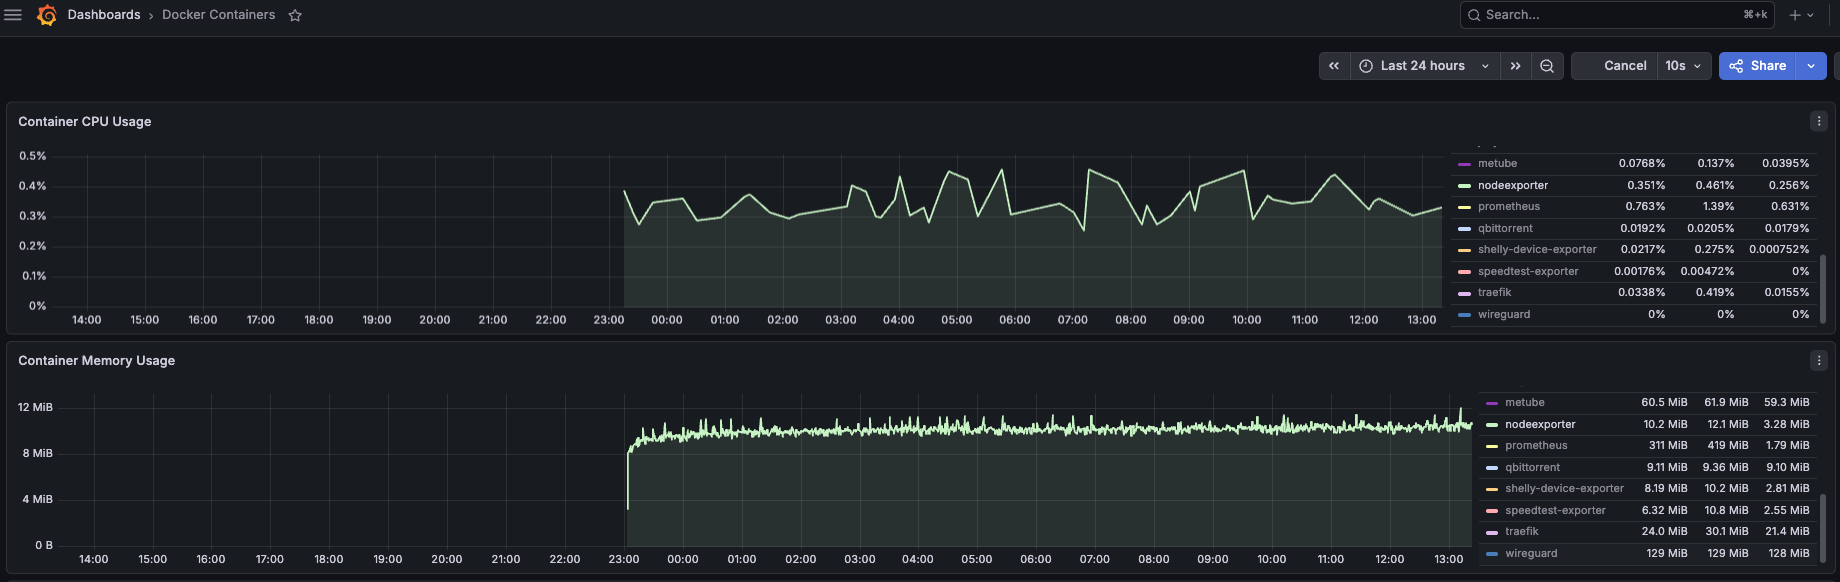
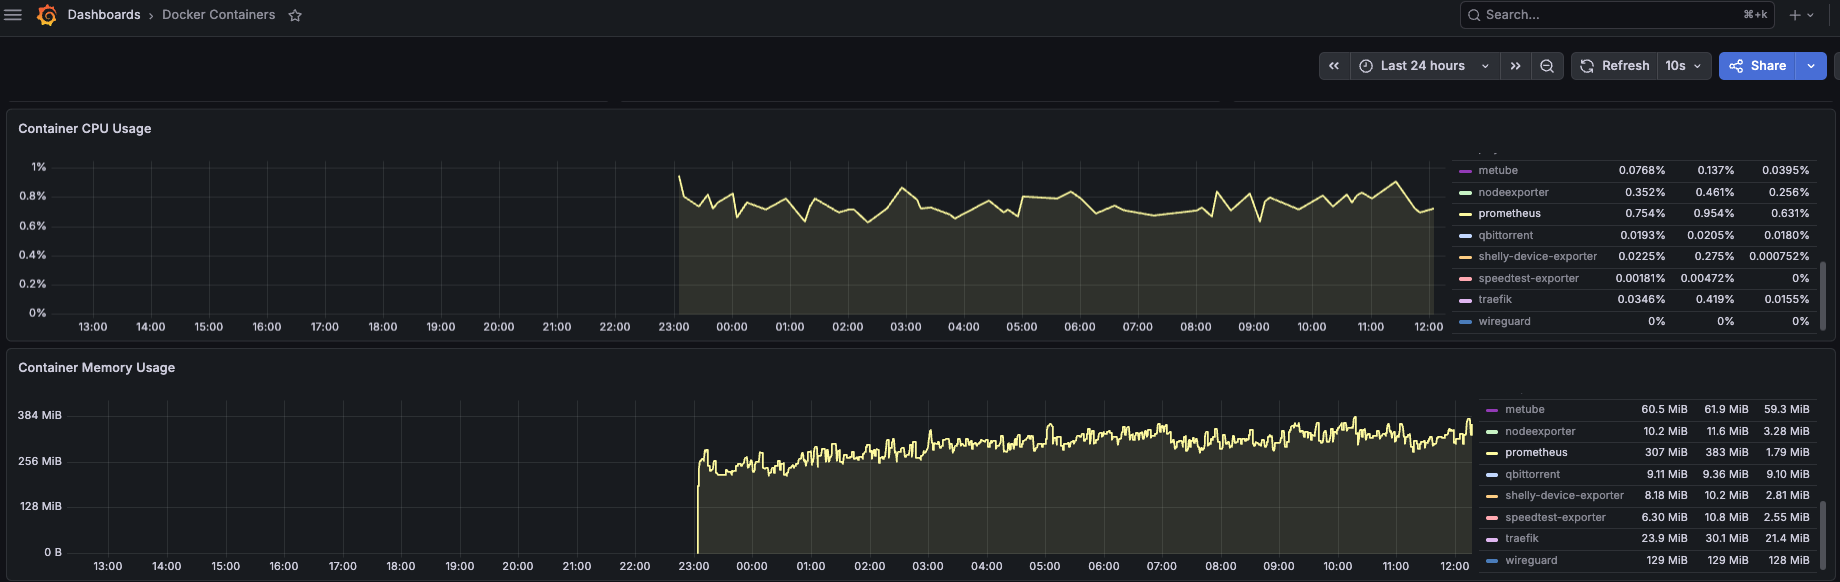
Prometheus itself was holding around 307 MB of memory. Not terrible, but VictoriaMetrics promised to do the same job with a significantly smaller footprint.
The goal wasn’t just to reduce numbers on a graph. I wanted to free up headroom so I could run more useful services, and I wanted to go from two containers for container monitoring (node_exporter + cAdvisor) down to one.
Replacing Node Exporter and cAdvisor with FluentBit
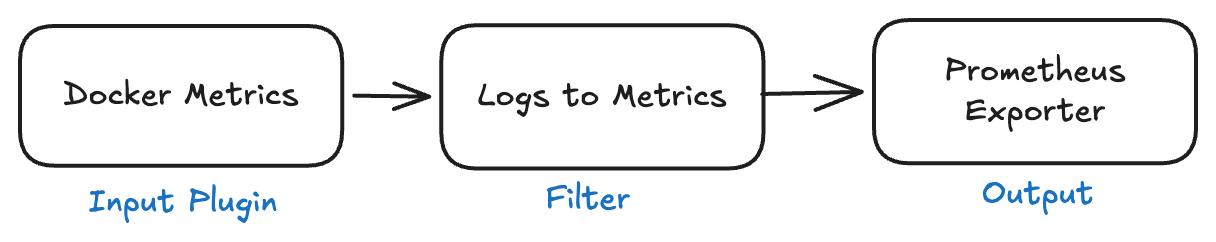
FluentBit started as a lightweight log shipper, but it’s grown into a full observability agent. It can expose node metrics, collect Docker container stats, and ship logs — all from a single container. That’s exactly what I needed.
Node Metrics
FluentBit has a node_exporter_metrics input plugin. The docs are upfront that it’s a subset of the full Prometheus node_exporter, but for a homeserver it covers everything that matters: CPU, memory, disk, filesystem, network, load average, and more.
pipeline:
  inputs:
    - name: node_exporter_metrics
      tag: node_metrics
      path.rootfs: /host
      collector.textfile.path: /opt/text_collector
      collector.textfile.scrape_interval: 900
      scrape_interval: 30
      metrics: cpu,cpufreq,meminfo,diskstats,filesystem,uname,stat,time,loadavg,vmstat,netdev,netstat,sockstat,filefd,nvme,processes,textfile

outputs:
  - name: prometheus_exporter
    match_regex: "^(node_metrics|docker_prom_metrics)$"
    host: 0.0.0.0
    port: 2021
The textfile collector is a bonus — FluentBit can read Prometheus textfile format via the Prometheus textfile input plugin. I use this to collect S.M.A.R.T. disk health data by running smartmon.sh on a schedule and dropping the output into /opt/text_collector. FluentBit picks it up automatically.
Docker Container Metrics
This part was trickier. FluentBit has a docker input plugin, but it outputs container stats as log records — not as Prometheus metrics. The trick is using the log_to_metrics filter to convert those records into actual metrics.
pipeline:
  inputs:
    - name: docker
      tag: docker_metrics
      interval_sec: 15
      path.containers: /host/var/lib/docker/containers
      path.sysfs: /host/sys/fs/cgroup

  filters:
    - name: lua
      match: docker_metrics
      call: strip_leading_slash
      code: |
        function strip_leading_slash(tag, timestamp, record)
          if record["name"] then
            record["name"] = record["name"]:gsub("^/", "")
          end
          return 1, timestamp, record
        end

    - name: log_to_metrics
      match: docker_metrics
      tag: docker_prom_metrics
      metric_mode: gauge
      metric_namespace: docker
      metric_subsystem: container
      metric_name: cpu_used
      metric_description: Total CPU usage in microseconds (cgroup v2 usage_usec; nanoseconds on cgroup v1)
      value_field: cpu_used
      label_field: [id, name]

    - name: log_to_metrics
      match: docker_metrics
      tag: docker_prom_metrics
      metric_mode: gauge
      metric_namespace: docker
      metric_subsystem: container
      metric_name: mem_used
      metric_description: Memory usage in bytes
      value_field: mem_used
      label_field: [id, name]

    - name: log_to_metrics
      match: docker_metrics
      tag: docker_prom_metrics
      metric_mode: gauge
      metric_namespace: docker
      metric_subsystem: container
      metric_name: mem_limit
      metric_description: Memory limit in bytes
      value_field: mem_limit
      label_field: [id, name]

  outputs:
    - name: prometheus_exporter
      match_regex: '^(node_metrics|docker_prom_metrics)$'
      host: 0.0.0.0
      port: 2021
The pipeline: FluentBit reads Docker container stats every 15 seconds → a Lua filter strips the leading slash from container names → log_to_metrics converts each stat field into a Prometheus-style gauge → the prometheus_exporter output exposes them on port 2021.
Why gauge and Not counter?
You might notice I set metric_mode: gauge for CPU metrics, which seems wrong. CPU metrics are cumulative counters by nature — shouldn’t they be declared as counter type?
I dug into this with Claude Code and found the answer in the FluentBit source:
case FLB_LOG_TO_METRICS_COUNTER:
    ret = cmt_counter_inc(ctx->c, ts, label_count, ctx->label_values);  // increments by 1 — ignores the field value
    break;

case FLB_LOG_TO_METRICS_GAUGE:
    ret = cmt_gauge_set(ctx->g, ts, gauge_value, ...);  // sets the raw field value ✅
    break;
counter mode in log_to_metrics ignores value_field entirely — it just increments by 1 on every log event. gauge mode actually reads the field value and sets it. Since cpu_used and mem_used from the docker input are already cumulative totals (ever-increasing), you want gauge mode to pass the raw value through. You then use rate() or increase() in your PromQL queries to derive the actual utilization.
How Close Are FluentBit Docker Metrics to cAdvisor?
Before fully committing to dropping cAdvisor, I ran both side by side and compared what they reported for the same containers at the same time.
Memory was a close match. CPU had a small but consistent discrepancy — FluentBit reported slightly higher utilization than cAdvisor. I tried both rate() and increase() in my queries but couldn’t get them to match exactly. My best guess is a difference in how each tool accounts for cgroup v1 vs v2 CPU accounting.
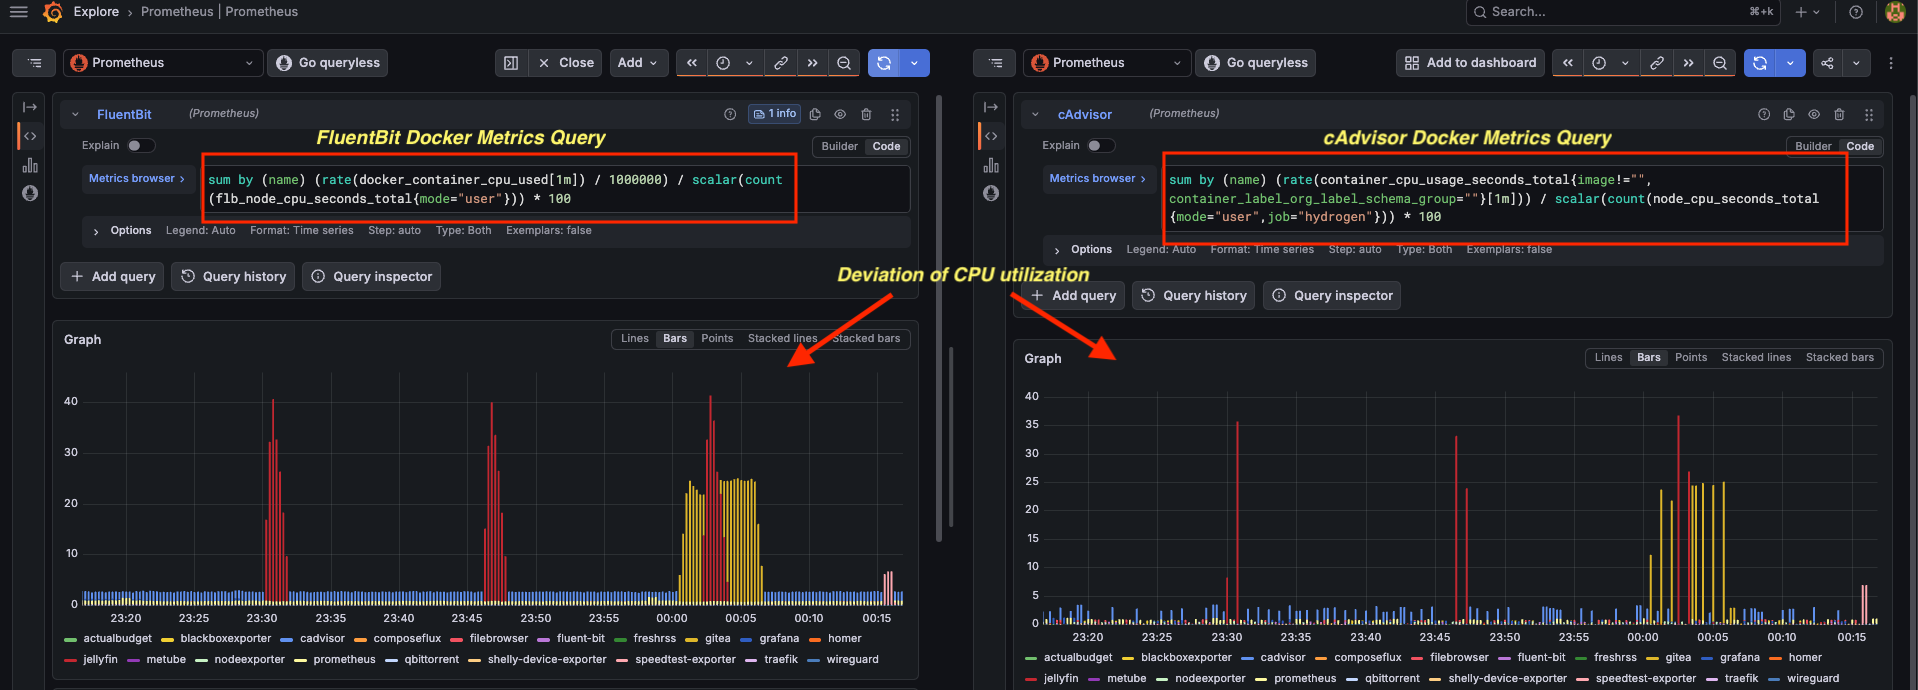
Honestly? For a homeserver, this doesn’t matter. I’m not running an SRE team here. I use these graphs to see which container is eating the most resources, not to bill a customer. That slight inaccuracy I can live with — at least that’s what I told myself :-P
Switching to VictoriaMetrics
VictoriaMetrics can run in cluster mode or standalone. For a homeserver, standalone is the obvious choice — it’s a single binary, minimal configuration, and drops right in as a Prometheus replacement.
To keep resource usage low, I set these CLI flags:
-bigMergeConcurrency="1"
-dedup.minScrapeInterval="30s"
-memory.allowedPercent="70"
-promscrape.config="/prometheus.yml"
-retentionPeriod="30d"
-smallMergeConcurrency="1"
bigMergeConcurrency and smallMergeConcurrency cap the background compaction threads to 1 each, which keeps CPU usage flat. dedup.minScrapeInterval drops duplicate data points within the scrape window, which matters when scrape intervals align. memory.allowedPercent prevents VictoriaMetrics from consuming more than 70% of available RAM.
For Grafana, I added the VictoriaMetrics datasource plugin so Grafana talks to VictoriaMetrics natively rather than going through a Prometheus-compatible endpoint:
grafana:
  image: grafana/grafana:latest
  container_name: grafana
  environment:
    GF_INSTALL_PLUGINS: victoriametrics-metrics-datasource
The existing prometheus.yml scrape config worked without changes — VictoriaMetrics is Prometheus-compatible on the scrape side.
Up Next: Did It Actually Help?
The migration was straightforward enough. But the real question is whether the resource savings are meaningful in practice.
Part 2 has the before/after screenshots and the full comparison table — CPU utilization and memory for every tool, old stack vs new.