In Part 1, I walked through replacing Prometheus + node_exporter + cAdvisor with VictoriaMetrics + FluentBit on my homeserver. This is Part 2 — the actual numbers.
All measurements are mean values over a 12-hour window, collected from the containers themselves via cAdvisor (before) and FluentBit docker metrics (after). They’re approximate, but they paint a clear enough picture.
FluentBit vs Node Exporter + cAdvisor
FluentBit replaced two containers — node_exporter and cAdvisor — with one. Here’s what that looks like in practice.
FluentBit Resource Usage
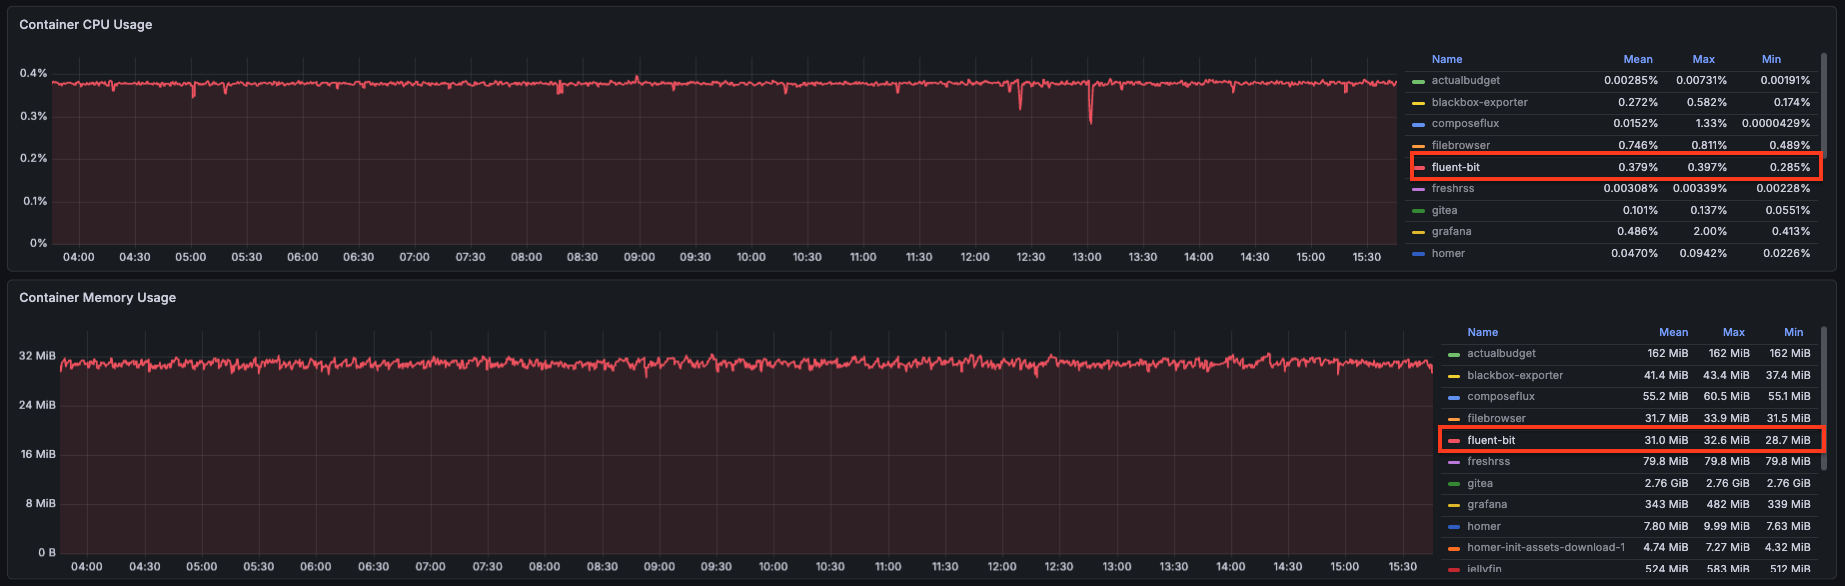
FluentBit handles both node metrics and Docker container metrics from a single container. Here’s how it compares to what it replaced:
| Tool | CPU Utilization | Memory Usage |
|---|---|---|
| node_exporter | 0.351% | 10.2 MB |
| cAdvisor | 2.59% | 55.2 MB |
| FluentBit | 0.379% | 31 MB |
One container instead of two, and cAdvisor’s 2.59% CPU is gone.
VictoriaMetrics vs Prometheus
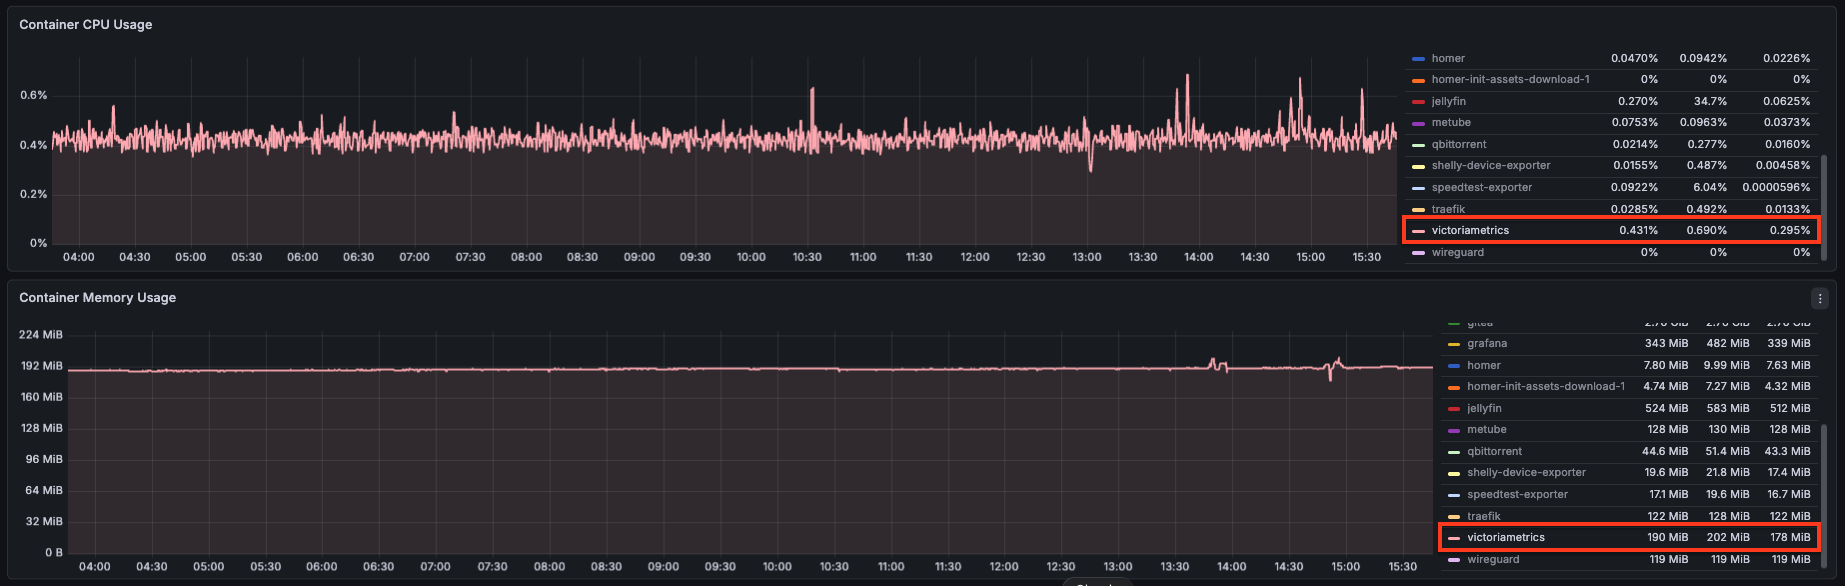
VictoriaMetrics with the tuning flags from Part 1 (bigMergeConcurrency=1, smallMergeConcurrency=1, memory.allowedPercent=70):
| Tool | CPU Utilization | Memory Usage |
|---|---|---|
| Prometheus | 0.754% | 307 MB |
| VictoriaMetrics | 0.431% | 190 MB |
The Full Comparison
| Tool | CPU Utilization | Memory Usage |
|---|---|---|
| Prometheus | 0.754% | 307 MB |
| VictoriaMetrics | 0.431% | 190 MB |
| node_exporter | 0.351% | 10.2 MB |
| cAdvisor | 2.59% | 55.2 MB |
| FluentBit | 0.379% | 31 MB |
Note: mean values over a 12-hour window. Not perfectly accurate, but good enough to see the trend.
New Stack Architecture
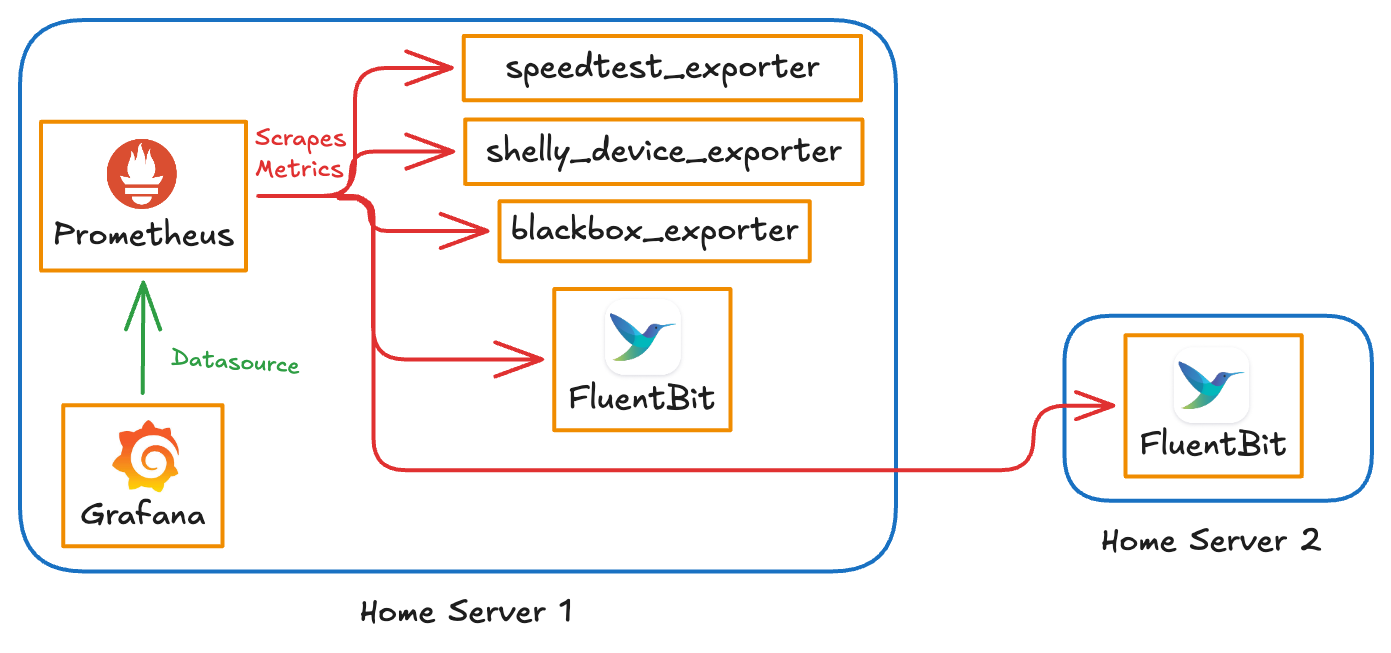
The architecture is simpler now. A single FluentBit container on each host exposes both node metrics and Docker container metrics on port 2021. VictoriaMetrics scrapes everything using the same prometheus.yml format. Grafana connects to VictoriaMetrics via the native datasource plugin.
The blackbox, speedtest, and Shelly exporters are unchanged — they were already lightweight and not worth touching.
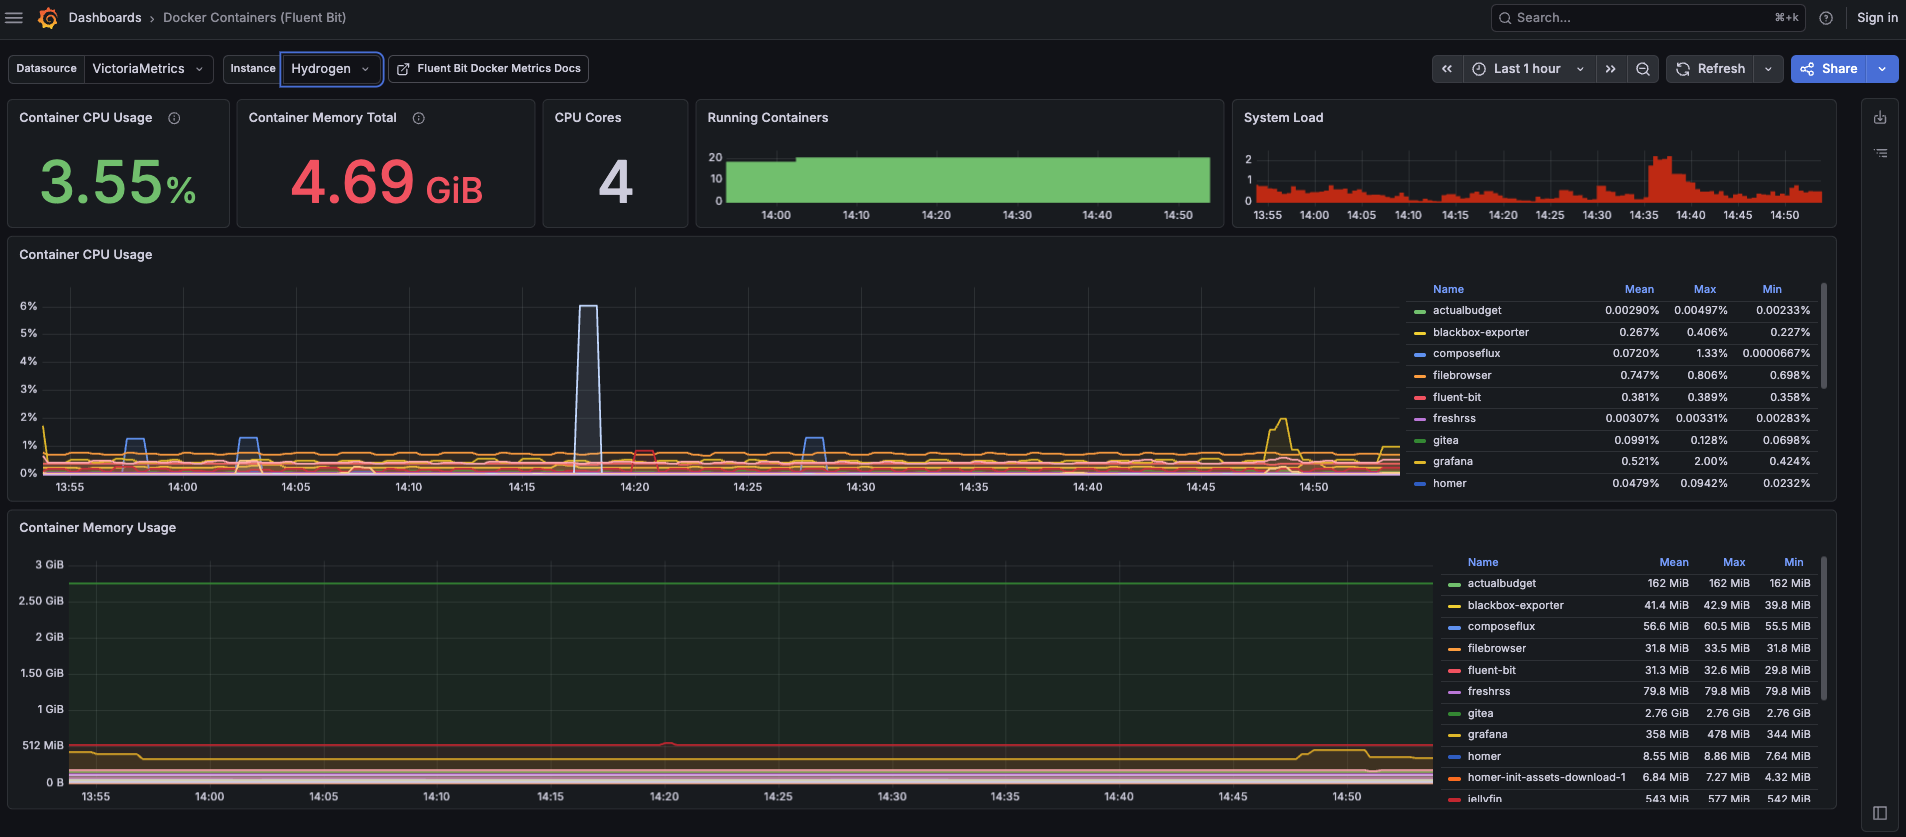
Dashboard Migration and Docker Metrics in Grafana
Migrating existing dashboards was mostly straightforward — switch the datasource from Prometheus to VictoriaMetrics in Grafana’s datasource settings. The PromQL queries work as-is since VictoriaMetrics is query-compatible.
The one place that needed new work was Docker container metrics. Since I was no longer using cAdvisor, I needed a fresh dashboard built around the FluentBit docker metrics (docker_container_cpu_used, docker_container_mem_used, etc.).
Both dashboards — the migrated system dashboard and the new Docker metrics one — are available here: github.com/veerendra2/assets/tree/main/grafana-dashboards/victoriametrics
Was It Worth It?
Yes — and the numbers back it up more clearly than I expected.
cAdvisor was the biggest surprise. It looked like a reasonable choice on paper, but at 2.59% average CPU it was the single heaviest thing in my monitoring stack by a wide margin. Replacing it with FluentBit’s docker input, combined with the log_to_metrics pipeline, cut that cost almost entirely.
VictoriaMetrics is a straightforward win for anyone already running Prometheus. Drop-in replacement, smaller footprint, and the native Grafana plugin means slightly better query performance.
The only rough edge is the slight CPU discrepancy between FluentBit and cAdvisor docker metrics I mentioned in Part 1. I still haven’t pinned down the exact cause. For homeserver use it genuinely doesn’t matter — I’m watching trends, not billing by the millisecond.
The monitoring stack went from something I was vaguely aware was “a bit heavy” to something I don’t think about at all. That’s exactly what monitoring infrastructure should feel like.