Ok, getting metrics(CPU, Memory & Network) from Windows OS is completely different from Linux. In Linux, people can easily develop scripts to get system metrics by simply reading /proc pesudo files. In fact there are so many open source tools to do this in Linux, like tcollector which is my favourite.
Now, Let’s look at this Telegraf tool and what it does. I found Telegraf tool is really simple, elegant way to collect Windows OS metrics and light weight too, unlike others which some are paid and crappy. This tools doesn’t provide any wizard installation to setup, but one has to run a command in Windows powershell to install it as Windows service. It supports multiple TSDB backend storage like Graphite, OpenTSDB, etc but I have tested only with OpenTSDB.
As they said in Github repo and I quote
Telegraf is an agent written in Go for collecting, processing, aggregating, and writing metrics.
Design goals are to have a minimal memory footprint with a plugin system so that developers in the community can easily add support for collecting metrics from local or remote services.
-
Goto influxdata download portal and download
Telegrafzip file -
Create a folder and name it as
TelegrafinC:\Program Filesand extract the .zip content toTelegraffolder (C:\Program Files\Telegraf) -
Download telegraf configuration from here (telegraf.conf) and place it in
C:\Program Files\Telegraf
- Specify OpenTSDB server IP in
outputs.opentsdbsection in the configuration

-
Open “Windows PowerShell” with administrator rights(Run as administrator) and paste below command to create “windows service”
C:\"Program Files"\Telegraf\telegraf.exe --config C:\"Program Files"\Telegraf\telegraf.conf –-service install -
In Windows
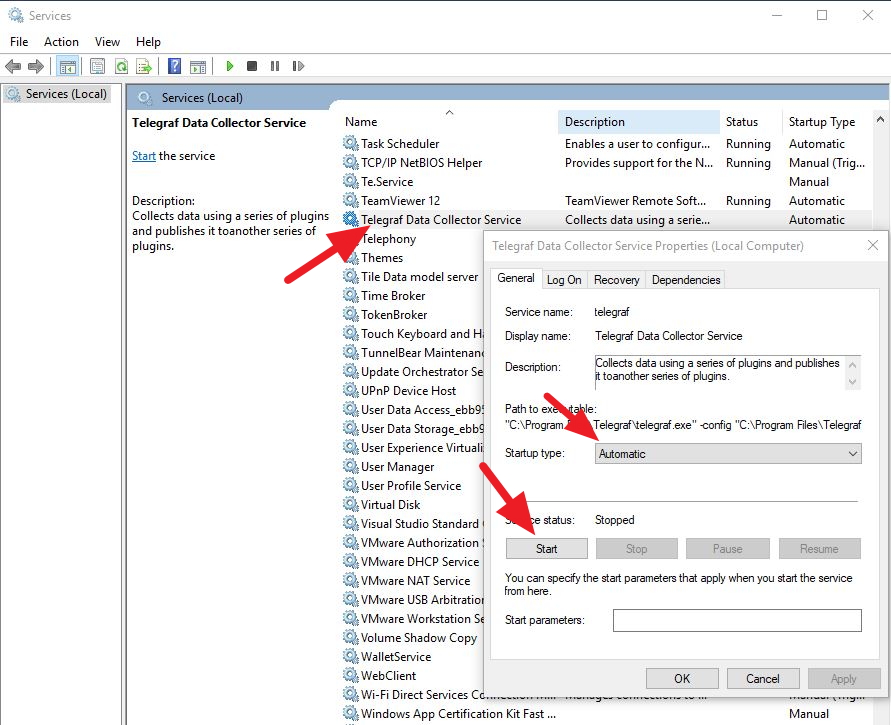
Services, you should seeTelegrafservice. Right-click on the Telegraf service, open"Properties"-> Select "Automatic"for “Startup Type” and click “Start” button to start the Telegraf service.

You should able to see these metrics in your OpenTSDB
