I keep mixing up rate() and increase() in PromQL, so this is a short note for future reference.
Both functions are normally used with counters: metrics that only go up, except when the process restarts and the counter resets.
The quick difference:
rate()answers: how fast is it increasing?increase()answers: how much did it increase?
rate()
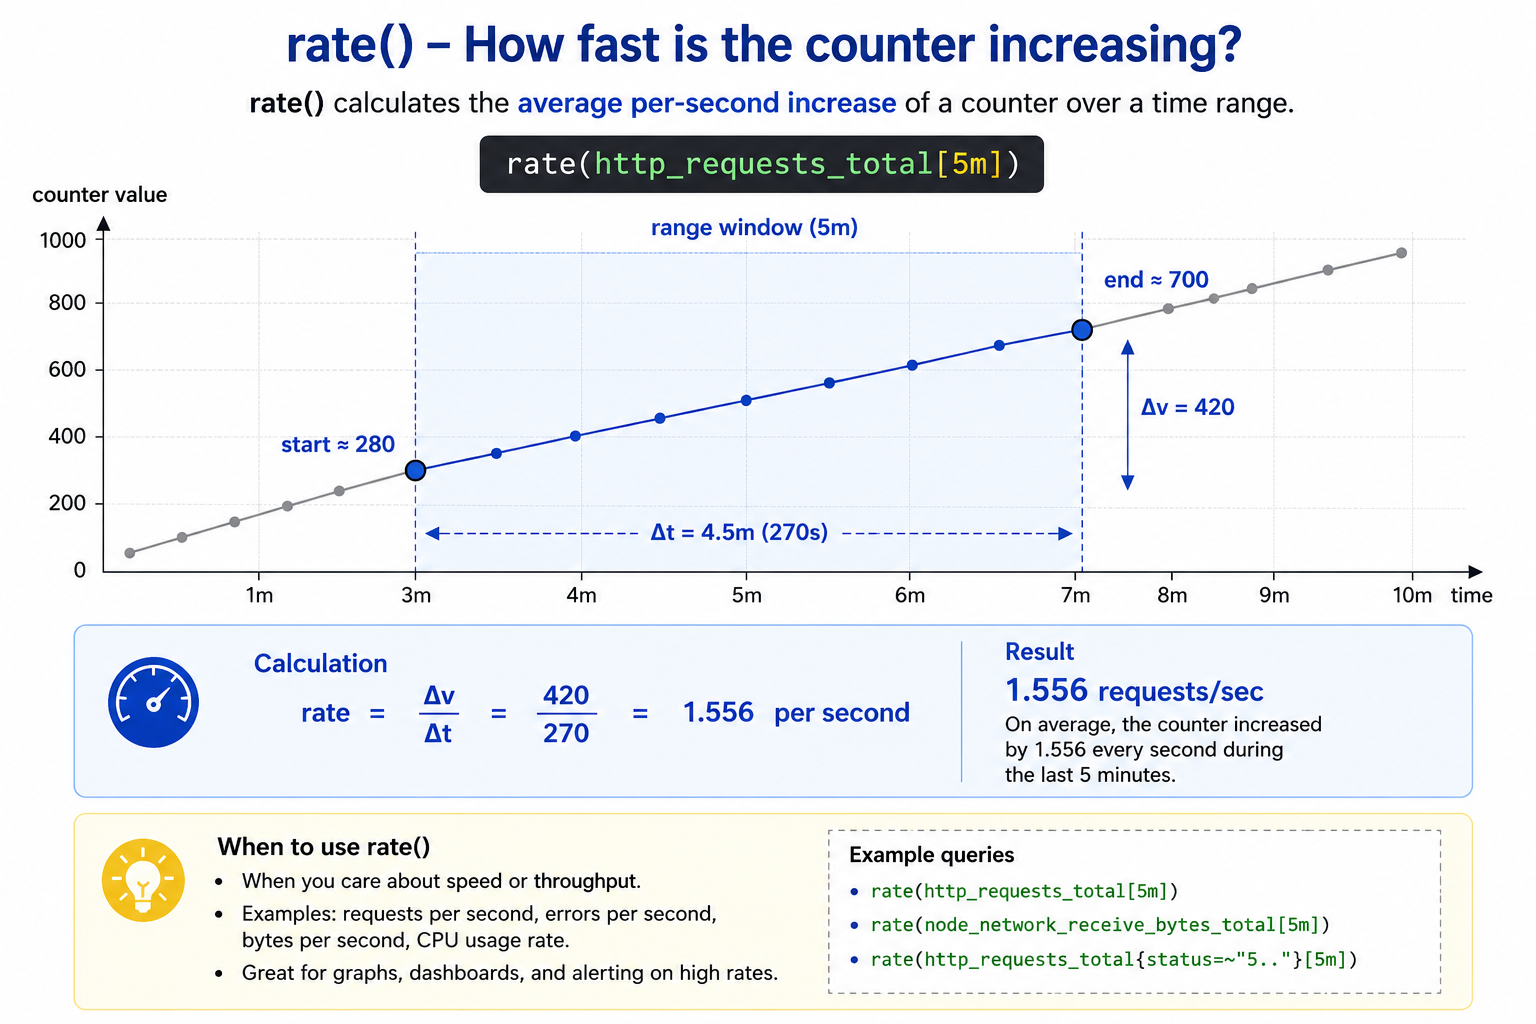
rate() gives the average per-second increase over a time range.
rate(http_requests_total[5m])
If the counter moved from around 280 to 700, the increase is 420. In this example the sampled time difference is 270 seconds, so:
420 / 270 = 1.556 requests/sec
Use rate() for graphs, dashboards, and alerts where you care about speed or throughput:
- requests per second
- errors per second
- bytes per second
- CPU usage rate
increase()
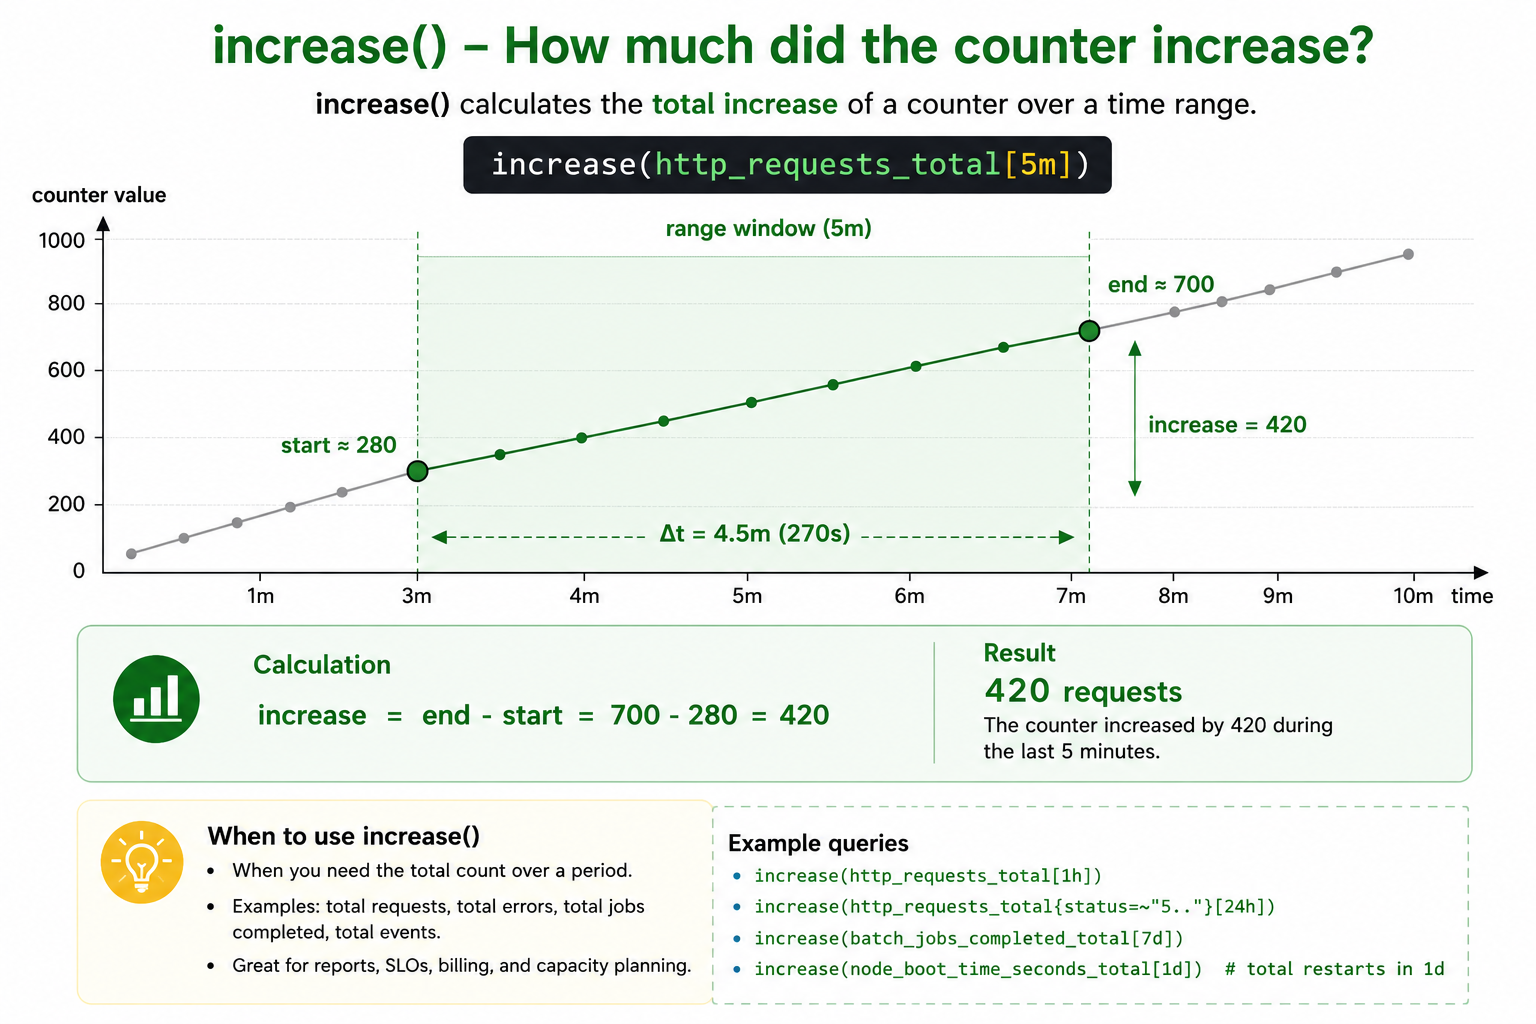
increase() gives the total increase over a time range.
increase(http_requests_total[5m])
With the same counter values:
700 - 280 = 420
So the result means roughly:
420 requests happened during the selected range.
Use increase() when you want a count for a period:
- total requests in the last hour
- total errors in the last 24 hours
- total jobs completed in a week
- total restarts during a range
Remember
Ask the query in plain English:
- “How many per second?” ->
rate() - “How many in this time window?” ->
increase()
They are closely related:
increase(v[5m]) ~= rate(v[5m]) * 300
300 is the number of seconds in 5 minutes.
Small Prometheus detail: both functions handle counter resets and may extrapolate values to cover the full range window. So in real queries the result may not always be exactly last - first, but that is the right mental model.
| Function | Returns | Good for |
|---|---|---|
rate() | Per-second rate | dashboards, alerts, throughput |
increase() | Total increase | reports, totals, period counts |
Simple memory hook: rate() is speed, increase() is count.