I was testing a new ComposeFlux feature on my homeserver. As part of some maintenance work, I restarted the servers, and when I opened Grafana a few minutes later to check that everything had come back, every metric before 19:18 was gone. New data was arriving fine; the entire history just ended at that minute.
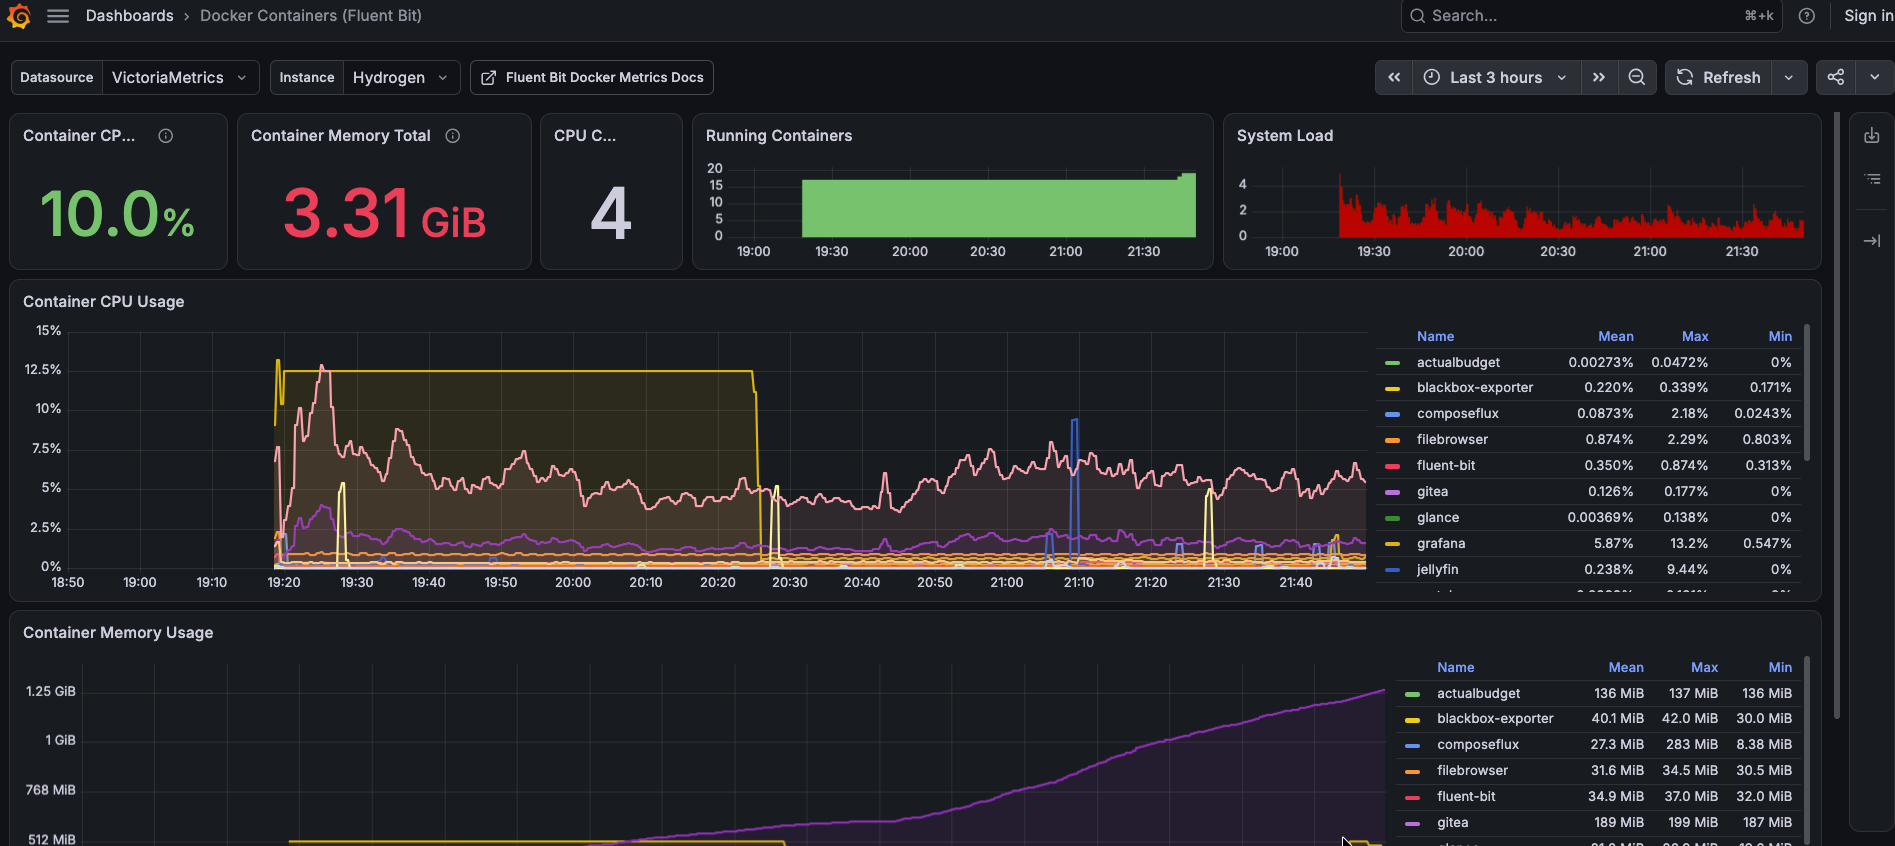
Because this happened right after a ComposeFlux test and a restart, my first suspect was obvious: had ComposeFlux recreated the VictoriaMetrics container or pruned its Docker volume?
It hadn’t. The real cause was more interesting: my Raspberry Pi had rebooted with its clock 32 days behind, and VictoriaMetrics treated the stored data as being far in the future, outside its retention window, and deleted it.
Codex helped me get there quickly by working through the usual suspects: the Docker volume, the container metadata, ComposeFlux’s logs, the host journal, VictoriaMetrics’s own logs, and finally the stored metrics themselves, through the VictoriaMetrics API.
Checking the Docker Volume
The volume was my first check, and it still existed, untouched:
Name:      victoriametrics_data
Created:   2026-06-16T14:17:25+02:00
Mounted:   /victoria-metrics-data
The container was no newer either: it had been created on August 24, days before the incident. And ComposeFlux’s logs showed no VictoriaMetrics deployment, no stack removal, and no volume prune around 19:18. So the recreate-or-prune theory was dead: the same container was still using the same volume.
The Timeline
With ComposeFlux ruled out, the host logs explained what actually happened:
| Date | Time | Event |
|---|---|---|
| 29.08.2026 | 19:12 | The homeserver shut down and rebooted |
| 28.07.2026 | 17:04 | The Raspberry Pi believed this was the current time after boot |
| 17:06 | VictoriaMetrics opened the existing storage | |
| 29.08.2026 | 19:18 | NTP corrected the clock by 2,772,598 seconds |
| 19:18 | VictoriaMetrics started accepting new August data again |
The two 28.07.2026 rows are what the Pi’s clock claimed at the time; the real date was still 29.08.2026.
The fix showed up in the journal:
ntpd: CLOCK: time stepped by 2772598.848847
ntpd: CLOCK: time changed from 2026-07-28 to 2026-08-29
The Pi has no real-time clock:
RTC time: n/a
So it restored an old date during boot and started Docker before NTP had synchronized. VictoriaMetrics reopened its storage while the machine still believed it was July 28.
Why VictoriaMetrics Removed the Data
My VictoriaMetrics configuration uses a 30-day retention period:
command:
  - "-retentionPeriod=30d"
VictoriaMetrics also accepts future samples only up to now+2d by default. This is controlled by
-futureRetention.
When VictoriaMetrics started with the July 28 clock, the data already stored for August looked like it was 27 to 32 days in the future. That is far outside the two-day future-retention window, so the retention logic dropped it.
After NTP moved the clock forward, samples collected during the bad window hit the opposite problem:
cannot insert row with too small timestamp;
minimum allowed timestamp is 1785431897000;
probably you need updating -retentionPeriod or -maxBackfillAge
The loss was in the storage itself, not a Grafana query problem:
Storage opened before clock correction:  76.8 MB
Storage after clock correction:           39.6 MB
A direct query to the VictoriaMetrics API confirmed it: no up samples before 19:18, normal samples after. The Docker
volume survived; the historical data parts inside it didn’t.
Preventing This
I haven’t fixed this yet, but the direction is systemd boot order: Docker, and with it VictoriaMetrics, must not start until NTP has actually stepped the clock.
Docker already orders dockerd after
time-set.target, which waits until the clock has been set from local
sources. That was not enough here: my Pi set its clock to a stale date, and a stale date still counts as set. The
stronger gate is time-sync.target, which is only reached after a real NTP sync when
systemd-time-wait-sync.service is enabled. So the plan is a drop-in on the Docker unit:
# /etc/systemd/system/docker.service.d/wait-for-ntp.conf
[Unit]
Wants=time-sync.target
After=time-sync.target
First enable the wait service (systemctl enable systemd-time-wait-sync.service), because time-sync.target is
reached as soon as the NTP daemon reports ready, not when the clock is actually right
(systemd issue #5097). My ntpd is not timesyncd either, so I still
need to check how the wait service detects its sync. I’ll update this post once I’ve tested it on the Pi.