Prometheus Metrics
ComposeFlux exposes Prometheus metrics on the address configured via METRICS_ADDR (default :9090). Set it to empty to disable.
Available Metrics
| Metric | Type | Labels | Description |
|---|---|---|---|
composeflux_deployments_total |
Counter | stack_name |
Total number of stack deployment attempts |
composeflux_deployment_failures_total |
Counter | stack_name |
Total number of failed stack deployments |
composeflux_image_updates_total |
Counter | stack_name |
Total number of stack image update attempts |
composeflux_image_update_failures_total |
Counter | stack_name |
Total number of failed stack image updates |
composeflux_stacks_pruned_total |
Counter | stack_name |
Total number of managed stacks removed during pruning |
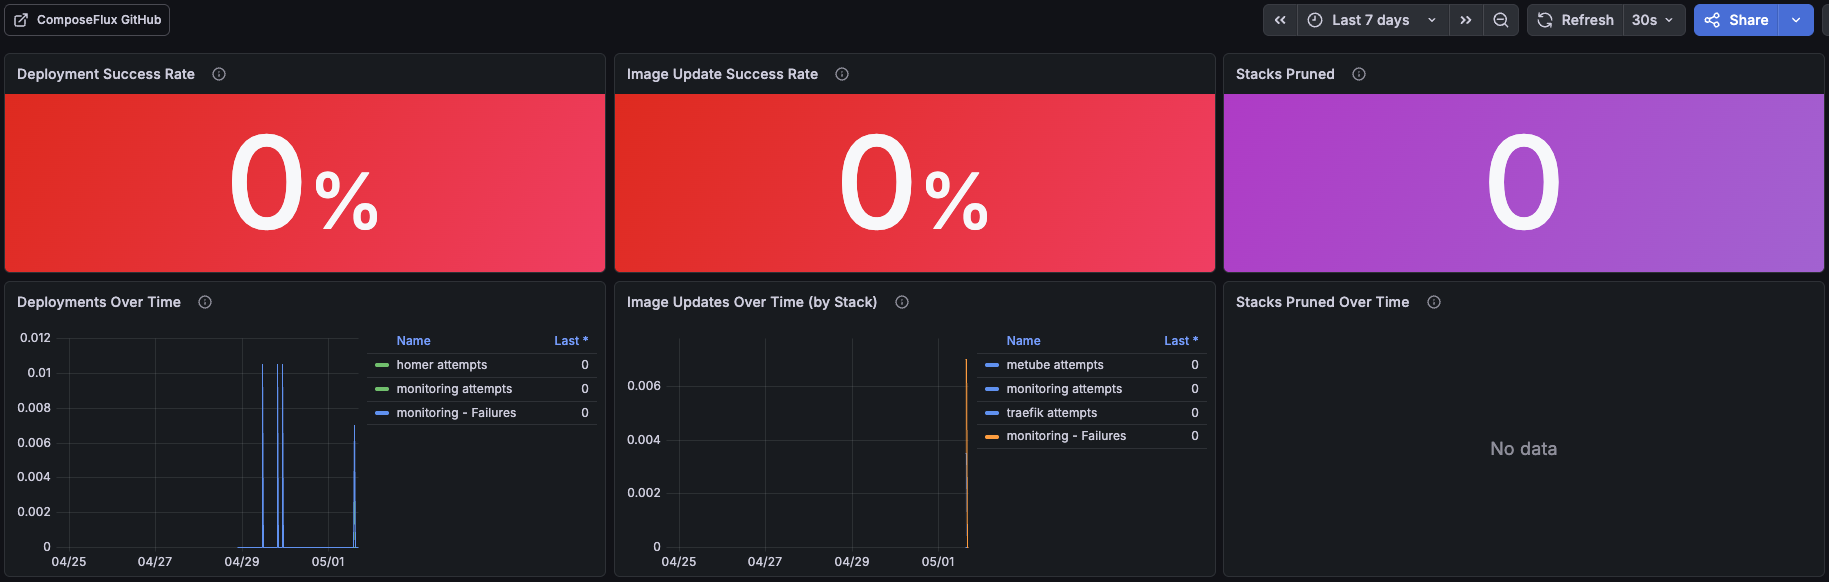
Grafana Dashboard
A pre-built Grafana dashboard is available at docs/dashboards/grafana-dashboard.json.
Import it via Grafana UI (Dashboards → Import → Upload JSON file).